
Understanding Bitcoin Price Live Chart
The bitcoin price live chart is a vital tool for anyone involved in cryptocurrency trading. It provides real-time updates on the price movements of Bitcoin against various currencies, predominantly the US Dollar. This dynamic chart enables users to see fluctuations in Bitcoin’s market value and assists traders in making informed decisions based on current market conditions.
What is a Bitcoin Price Live Chart?
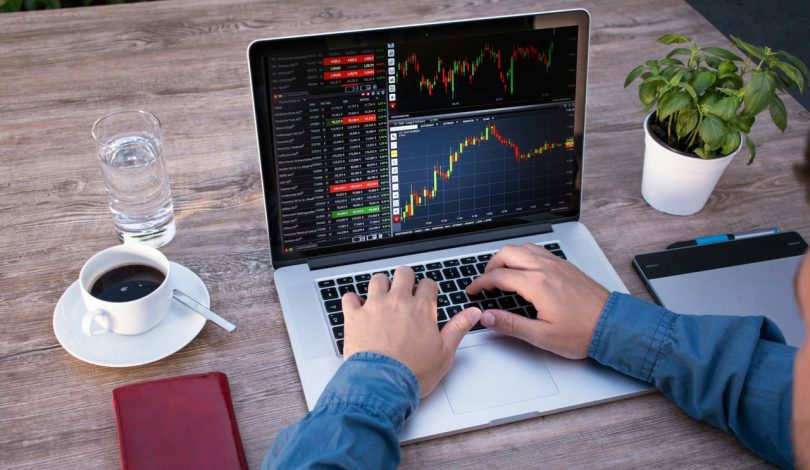
A Bitcoin price live chart is a graphical representation that displays the price of Bitcoin in real-time. It typically includes various features such as different time frames, price levels, volume indicators, and technical analysis tools that allow users to interpret price movements effectively. These charts often aggregate data from multiple exchanges to give a comprehensive view of Bitcoin’s market status.
Importance of Real-Time Data
In the fast-paced world of cryptocurrency, real-time data is crucial. The bitcoin price live chart updates frequently, reflecting immediate market changes. This immediacy is essential for making trading decisions, as even minor price shifts can influence the profitability of a trade. Investors leveraging real-time information can react swiftly to market movements, capitalizing on opportunities or mitigating losses.
Key Terminology in Price Charts
Understanding the terminology used in price charts is essential for interpreting them accurately. Some common terms include:
- Candlesticks: These graphical representations show price movements over specific periods, including open, close, high, and low prices.
- Support and Resistance Levels: These are price points where Bitcoin historically tends to stop and reverse its direction.
- Volume: This refers to the number of Bitcoin traded over a particular time frame, indicating market activity levels.
- Market Cap: The total market value of Bitcoin, calculated by multiplying its price by the total supply of coins in circulation.
How to Read a Bitcoin Price Live Chart
Reading a Bitcoin price live chart might seem daunting at first, but with a clear understanding of the components and patterns, one can easily grasp the essential insights it offers. Here is a detailed guide on how to effectively interpret the chart data.
Identifying Trends and Patterns
Trends are directional movements in price, which can be upward (bullish), downward (bearish), or sideways. To identify these trends, traders often utilize chart patterns such as head and shoulders, flags, and triangles, which signal potential market movements. Recognizing these patterns early can provide a competitive edge.
Understanding Price Movements
Price movements are influenced by supply and demand factors in the market. Observing the changes in the live chart can help traders gauge market sentiment. For instance, if Bitcoin’s price hits a new high but the volume is low, it might indicate a lack of substantial buying interest, suggesting the price could decline soon.
Using Technical Indicators
Technical indicators are mathematical calculations based on the price and volume of Bitcoin, designed to forecast future price movements. Common indicators include:
- Moving Averages: These smooth out price data to highlight trends over a specific time frame.
- Relative Strength Index (RSI): This momentum oscillator measures the speed and change of price movements, helping identify overbought or oversold conditions.
- Bollinger Bands: These indicate volatility by showing price levels outside of which prices have moved significantly from the moving average.
Factors Influencing Bitcoin Price
Several factors can influence the price of Bitcoin, shaping its volatility and market behavior. Understanding these can help traders navigate the complexities of the Bitcoin market.
Market Sentiments and News Impact
Market sentiment is a powerful driver of price fluctuations. Positive news such as institutional adoption can cause price surges, whereas regulatory concerns, news of hacking incidents, or negative press can lead to sharp declines. Traders must stay informed and monitor news sources to gauge sentiment effectively.
Regulatory Developments
Regulatory news can have a profound impact on the Bitcoin market. Governments around the world are continuously evaluating cryptocurrencies, with some easing restrictions while others impose stricter regulations. These developments can create volatility in Bitcoin prices as traders react to regulatory news.
Technological Innovations
Technological advancements, such as updates to the Bitcoin protocol or improvements in blockchain technology, can significantly influence Bitcoin’s price. Innovations that enhance security, scalability, or transaction efficiency can drive up demand, resulting in price increases.
Trading Strategies Using Bitcoin Price Live Chart
Utilizing a Bitcoin price live chart effectively requires adopting sound trading strategies tailored to individual goals and risk tolerance. Here, we explore various strategies based on chart analysis.
Day Trading vs. Long-Term Investments
Day trading involves making multiple trades within a single day to capitalize on short-term market movements. Traders rely heavily on the live chart to identify entry and exit points. In contrast, long-term strategies involve holding Bitcoin over extended periods, allowing traders to benefit from overall market trends rather than short-lived price swings.
Utilizing Chart Patterns for Predictive Analysis
Chart patterns provide valuable insights for predictive analysis. Patterns like ‘double tops’ or ‘bullish flags’ can signal potential price reversals or continuations. Traders use these signals alongside other indicators to form decisions that enhance their chances of successful trades.
Risk Management Techniques
Effective risk management is essential for sustainable trading. Techniques include setting stop-loss orders to limit potential losses, diversifying investments, and only risking a small percentage of trading capital per trade. Adopting these strategies can help traders maintain control over their finances, even during volatility.
Frequently Asked Questions about Bitcoin Price Live Chart
What data is displayed in a Bitcoin price chart?
A Bitcoin price chart displays real-time prices, past price movements, volume data, market cap, and various technical indicators that help analyze trends.
How frequently is the Bitcoin price updated in live charts?
Bitcoin prices in live charts are typically updated in real-time, providing up-to-the-minute information crucial for trading decisions.
Can I use a Bitcoin price chart for other cryptocurrencies?
Yes, many platforms allow users to view price charts for various cryptocurrencies, not just Bitcoin, enabling diverse trading opportunities.
What are the common mistakes when reading price charts?
Common mistakes include ignoring market trends, failing to use technical indicators effectively, and overreacting to short-term market fluctuations.
How can understanding price trends improve my trading strategy?
Understanding price trends helps traders identify potential entry and exit points, manage risks, and align their strategies with market behavior.